

Introduction
Your highest-value account stopped using a core feature on Tuesday. They opened two support tickets on Wednesday, both labeled 'high severity.' Your weekly churn report won't flag the account until next Monday.
The gap between those two events is the exact window where recurring revenue is won or lost. Retention in 2026 is not about logging into a dashboard every morning.
The real constraint is reliable, interoperable data, not visualization. The standard batch-report operating model, built on lagging indicators, now represents a direct competitive liability.
Braze research confirms that trust and product quality are 3.3X more important than discounts for repeat purchases. A discount might buy you a quarter, but it won't fix a broken product experience. The technical possibility has now caught up to the commercial imperative. By ingesting clickstream, support ticket, and engagement event data through a streaming architecture, post-sales teams can collapse the detection-to-action gap from days to minutes. This article lays out that practical architecture: the predictive signals, the streaming machine, the automated yet human-verified playbooks, and the 2026 team model that turns faint behavioral data into retention-led growth.
Key Takeaways
Every element of a modern retention strategy converges on collapsing the time between signal and action, without losing the human judgment that makes recovery possible. Here is what defines the shift:
- Predictive signals matter more than lagging metrics: A falling velocity in meaningful actions, measured as a delta across 30-, 60-, and 90-day windows, is the earliest behavioral warning.
- A unified real-time architecture is mandatory: Centralizing signals from 40+ apps and over 100 dimensions compresses account triage from days to hours.
- Human-in-the-loop is a design requirement: Only 29% of consumers feel comfortable with AI-driven personalization, making human verification non-negotiable for high-value accounts.
- The 2026 operating model breaks team silos: CS, solutions, and RevOps must run on the same unified platform, not on scattered docs and Slack threads.
- Measurable ROI comes from defined playbooks: Controlled tests show that scoring plus execution can increase upsell lift by around 25% and prove causality, not just correlation.
Real-Time Retention Insights: Definition and Distinction from Periodic Reporting

The difference between the two approaches is how quickly your data can change a customer's outcome. A weekly dashboard tells you who already left. A real-time system flags who is about to, while your team can still do something about it.
Here is how they compare across the dimensions that matter:
| Dimension | Periodic Batch Reporting | Real-Time Retention Insights |
|---|---|---|
| Time-to-Insight | Days to weeks, gated by scheduled ETL runs and analyst availability. | Minutes, powered by streaming events and continuous computation. |
| Data Scope | Static snapshots: CRM fields, last-login stamps, quarterly NPS. | Live behavioral streams: click paths, feature events, support ticket cadence, session logs. |
| Actionable Signal | A retrospective cohort view confirming logo churn rose last month. | A triggered alert on a specific account where feature use just dropped or support tickets spiked. |
| Primary Risk | Silent churn. The stakeholder switches before the report is reviewed. | Alert noise. Raw event volume without probability thresholds buries the team. |
| Team Posture | Reactive, responding to cancellation notices and renewal blocks. | Proactive, launching a rescue playbook when correlated behavioral markers fire. |
The real shift moves the system of record from a warehouse holding last quarter's summaries to an Eventhouse computing churn probability scores every minute against live streams. The legacy gap is not a reporting preference. It is a data architecture problem.
The Predictive Signals: Data Sources That Foretell Churn and Expansion
The most predictive churn signals in B2B SaaS are not found in a single field of your CRM. They emerge from the relationship between support ticket velocity, feature adoption trajectories, and session frequency declines. A customer health score that aggregates usage metrics, engagement signals, NPS, product adoption, and renewal likelihood into a single view becomes the foundation for detection. The earliest behavioral warning is a falling velocity in meaningful actions, not just total logins. An account that logs in daily but only skims the surface is not healthy.
Telemetry tells you what happened. It does not tell you why engagement dropped.
Support ticket analysis provides the leading emotional indicator. A spike in frequency, paired with slower resolution times, creates a correlated signal that often surfaces 30 to 60 days before a non-renewal. Negative sentiment detected in NPS verbatim or CSAT follow-up text can interpret behavioral data in a way telemetry cannot, but the operating principle here is firm: use sentiment to explain, not to decide. Let the numeric deltas anchor the risk score.
Expansion signals work on the same logic in reverse. Feature adoption milestones, increased seat utilization rates, and consumption patterns that exceed the plan threshold are predictive of upsell readiness. Customers who combined structured scoring with these emotional and behavioral signals report about a 30% improvement in customer satisfaction after adopting health scoring. The system that identifies churn risk becomes the same system that prioritizes expansion.
The Real-Time Machine: An Architecture for Minutes-Fast Detection
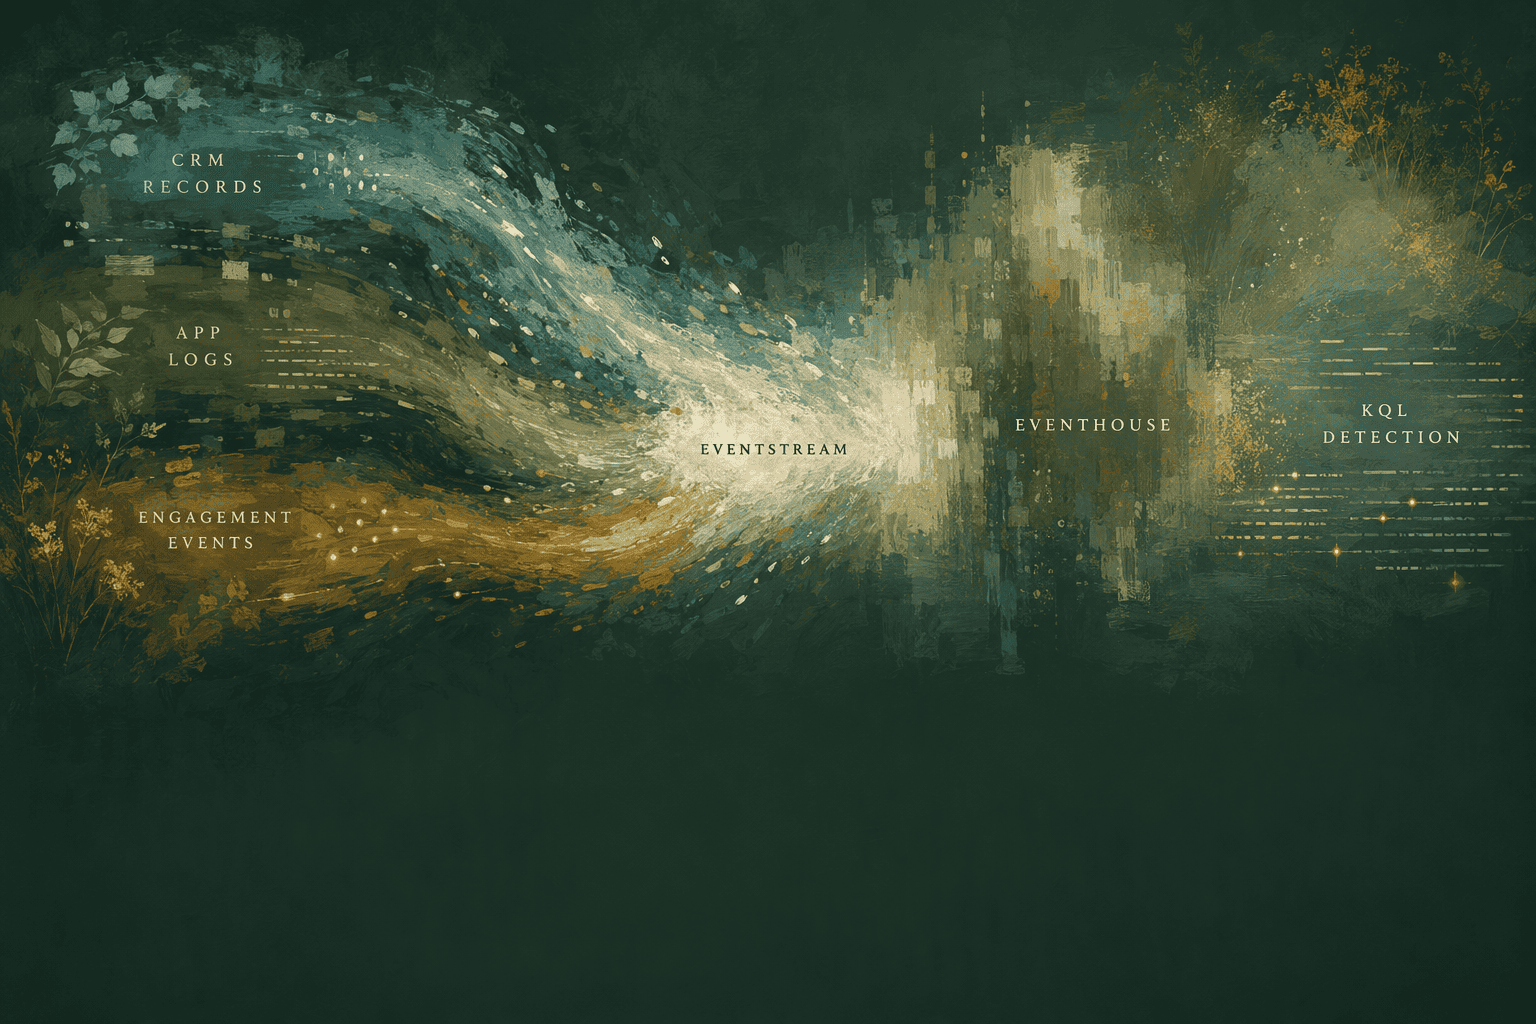
A functioning real-time retention machine does not require a rip-and-replace of your existing stack. It layers a streaming intelligence tier on top of the systems already producing data.
Take the pipeline Microsoft documents for Fabric's real-time intelligence. CRM records, application log data, and user engagement events feed into an Eventstream and land in an Eventhouse. A KQL database runs survival analysis models and anomaly detection against that continuous flow, then emits a churn probability score for each account. The score recalculates every minute. You can also trigger a narrative recompute on demand.
This is real-time detection you can deploy this quarter. The architecture surfaces tables, a narrative summary, and suggested intervention actions inside the same interface. You stop hunting for problems and start receiving specific risk drivers alongside a recommended next step.
From Signal to Action: Building Automated, Human-Verified Intervention Playbooks
A churn probability score with no routing logic is just interesting information. Turning a signal into a saved customer requires a defined playbook that distinguishes between high-confidence automations and scenarios requiring human judgment. Here is the step sequence that production retention teams follow:
- Define correlated risk thresholds: A single weak signal, one support ticket or one skipped login session, does not trigger action. A primary behavioral delta must correlate with a secondary signal, emotional or adoption-related, before the system fires.
- Route via an automation layer: When a processed insight exceeds the risk threshold, it flows to a tool like an Activator. The system starts a rescue playbook automatically on detection of churn risk.
- Segment by account tier: Digital-tier and mid-market accounts can receive automated outreach, such as an NPS or CSAT follow-up workflow. High-value enterprise accounts take a different path.
- Enforce mandatory human review for enterprise: Early-stage customers and high-value accounts require verification before any action or customer-facing message goes out. A Forward Deployed Engineer or CS lead examines the cited evidence and the narrative summary.
- Execute cross-channel intervention: Approved actions fire across the configured channels, driven by lifecycle stage and behavioral triggers, without anyone assembling data manually from separate systems.
- Adjust rules when false positives exceed 20%: The page on operational thresholds says to adjust automation rules when the false-positive alert rate exceeds 20%, preventing alert fatigue from eating away at the team's faith in the system.
The 2026 Operating Model: Structuring CS, Solutions, and RevOps Teams for Speed Without Noise

The organizational design question in 2026 is not whether to hire more CSMs. It is how to structure CS, solutions, and RevOps as a single customer-value function that acts on the same real-time signals instead of reconciling three different versions of account truth. The model that works abandons the fragmented stack of CRM dashboards, separate CS platforms, and Slack catch-up threads. Instead, those teams use one system of record that builds a unified customer record, updating in real time, where status rollups, dates, and playbook performance analytics all stay tied to the customer record.
The escalation path becomes straightforward. The platform detects a churn risk pattern and launches a rescue playbook with a suggested narrative that the system writes only if it can cite the underlying data. A designated operator, often a solutions or CS lead, reviews the fully cited account brief, verifies the signal against known account context, and either triggers the outreach or escalates into a high-touch intervention. The filtering mechanism is probabilistic scoring, not a human triaging unread email alerts. Noise drops because only correlated multi-signal events cross the threshold.
The Limits of Automation: Where Human Judgment Remains Non-Negotiable

Full retention automation is not a technical goal for 2026. It is an error to design for. Braze research puts the trust data bluntly: 47% of consumers lack confidence in how brands handle their data.
That statistic does not describe a minor PR risk. It describes a structural limitation on what machine-only retention flows can achieve. When your playbook triggers an automated email to a champion who just logged a support complaint about data handling, the intervention accelerates churn.
Automation cannot read nuance, negotiate renewals, or decide on communication style for struggling champions.
The comfort level with AI-driven personalization is even narrower. Only 29% of consumers say they feel comfortable with it. So the architecture that works in 2026 is one where the machine handles signal correlation, narrative drafting, and score computation every minute, and the human handles verification, relationship context, and the final decision to act.
The machine writes only what it can cite. It does not invent metrics or quotes. Certain account-specific details, like the reason a champion left the company or an upcoming organizational restructure, still require manual verification.
Human review remains mandatory for early-stage customers and high-value accounts. The operating model recommendation is not a universal requirement etched in stone, but the limits of data trust and automation comfort make this the prudent default for any retention architecture that touches customer-facing communication.
Measurable Improvement: Metrics and Workflows That Prove Retention ROI
The retention infrastructure described here requires budget, and budget requires proof that the playbooks reduce churn, not just detect it. Building that proof means defining the playbooks in terms of measurable thresholds, running the right analytic methodology, and tracking the metrics that the CFO and the board recognize. The sequence to demonstrate retention ROI follows this structure:
- Define playbooks tied to specific risk score thresholds: Each intervention type, automated NPS follow-up, mid-touch CSM reach-out, or executive escalation, maps to a defined churn probability band and a correlated signal pattern.
- Run cohort analysis to isolate causality: Comparing retention rates between accounts that received a triggered intervention against a comparable cohort that did not isolates whether the action reduced churn. Controlled tests have shown that scoring plus execution can increase upsell lift by around 25% and prove causality rather than correlation.
- Track gross revenue retention (GRR) and net revenue retention (NRR) as primary KPIs: GRR captures the health of the existing base stripped of expansion, while NRR captures the full revenue movement including upsell. Both must improve for the infrastructure to be considered ROI-positive.
- Monitor logo churn rate and time-to-save: The operational metric that matters is the percentage of at-risk accounts that return to a healthy behavior trajectory within 30 and 60 days of the rescue playbook firing.
- Report playbook performance analytics consistently: Track open rates, response rates, and saves per playbook. The data that proves ROI is also the data that tunes the false-positive threshold downquarter.
A System Blueprint: Unifying Streams, Scores, and Stories on a Single Platform

The endpoint of this architectural and operational shift is a single pane of glass where streaming behavioral data, probabilistic risk scores, and qualitative customer stories converge. The unified customer record tracks product usage milestones, feature adoption gaps, seat utilization, and engagement trends across every account, updated continuously, not batched.
You can use a tool like Quivly AI to operationalize this exact convergence. The platform works with the systems already producing customer data, Salesforce, HubSpot, Slack, Zendesk, Intercom, Gong, Snowflake, Databricks, BigQuery, Stripe, QuickBooks, and Jira, to build that unified record without a warehouse project or an engineering ticket. It surfaces tables, narrative summaries, and suggested actions in the same thread, with Notebooks that write fully cited account briefs that the system only composes from data it can point to in connected systems. The product emphasizes signal over noise, launching a rescue playbook when it detects churn risk and supporting NPS and CSAT follow-up workflows. Playbook performance analytics, including open rates, response rates, and saves per play, sit tied to the customer record to drive continuous threshold tuning.
The blueprint's value is not that it adds another tool. It replaces the scattered doc-and-thread patching pattern with a single record that CS, solutions, and RevOps teams see in the same view. The real constraint was never visualization. It was always data interoperability and time-to-insight. A unified platform operating on streaming event data removes both.
Conclusion
By the end of 2026, retention teams fall into two camps. One camp still leans on batch reports, compiled weeks after the user who could have been saved has already left. The other camp acts on correlated behavioral signals that recompute every 60 seconds.
The pieces are ready now: streaming ingestion into an Eventhouse, KQL-based modeling, and automated playbooks that still require a human set of eyes before any high-stakes action fires. What makes the whole thing work is not the automation by itself. It is the operating model. CS, solutions, and RevOps all run on the same platform, human review is mandatory on accounts that matter, and the digital-tier interventions happen on their own.
The shift is coming. The window to move before your competitors do is short.
Frequently Asked Questions
Sources
- Customer Health Score in SaaS: How to Calculate | Coworker AI - coworker.ai
- Customer Retention Management For Growth | Braze - www.braze.com
- Customer Churn Architecture with Fabric Real-Time Intelligence - Microsoft Fabric | Microsoft Learn - learn.microsoft.com


